The economic costs of injury include direct expenses to the health-care system. They also include indirect costs to society that result from lost productivity in the workforce.
In the figures below, use the filter drop-down menus to change the data shown. For more information on using these Tableau figures, see below.
The total economic cost of injury in Canada was $29.4 billion, including $20.4 billion in direct health-care costs. This direct cost translates to an average of $56 million spent per day in the Canadian health-care system that has the potential to be allocated to other needs in the system.
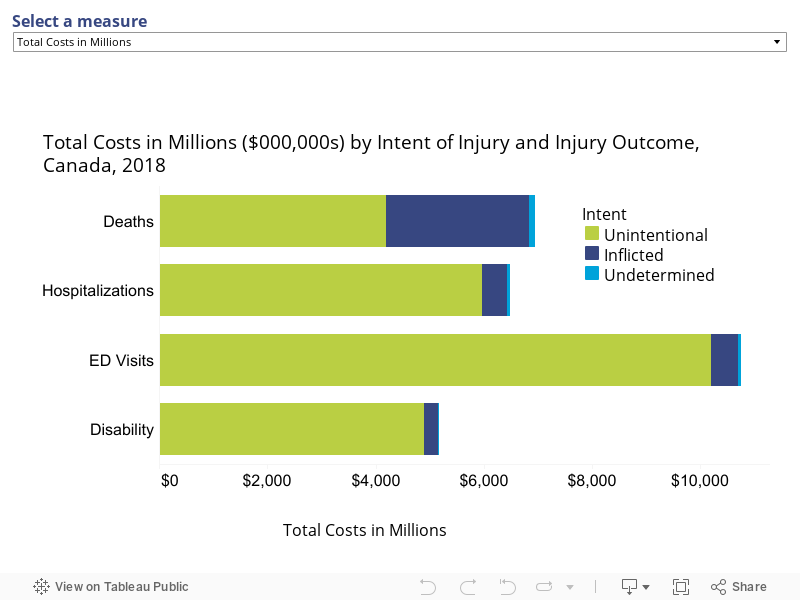
Cost by outcome and intent
In 2018, the total cost per injury death was $397,883. The total cost per injury disability was $84,280. The total cost per hospitalization was $27,981 and per emergency department (ED) visit was $2,360. Inflicted injuries and injuries of undetermined intent had higher costs per outcome for deaths, hospitalizations and ED visits, while unintentional injuries had a higher cost per outcome for injury-related disabilities.
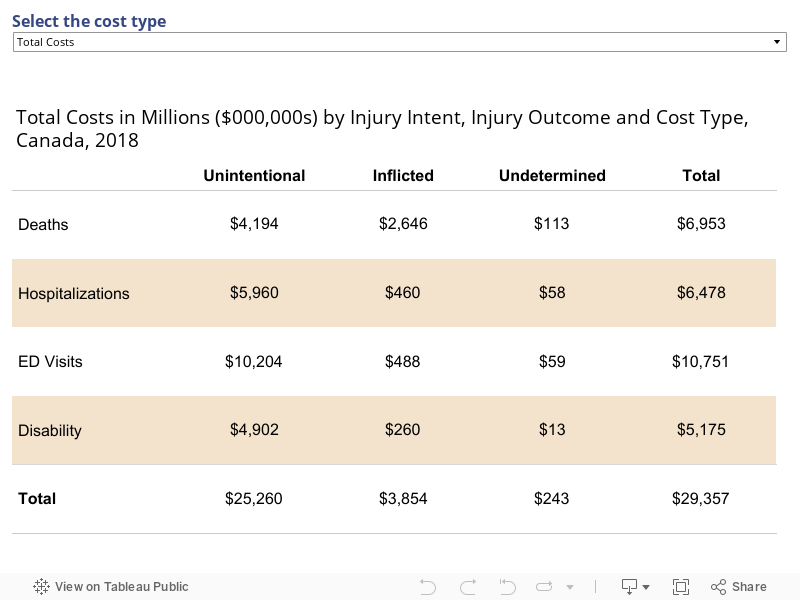
Cost by type of cost
The $6.4 billion in direct costs for hospitalized injuries in 2018 included $3.85 billion for hospital costs, $2.36 billion for medical costs and $0.2 billion for rehabilitation costs.
The direct cost of $10.8 billion for injuries seen in emergency departments in 2018 included $10.17 billion for medical costs and $0.58 billion for rehabilitation costs.
Percentage of cost by cost type
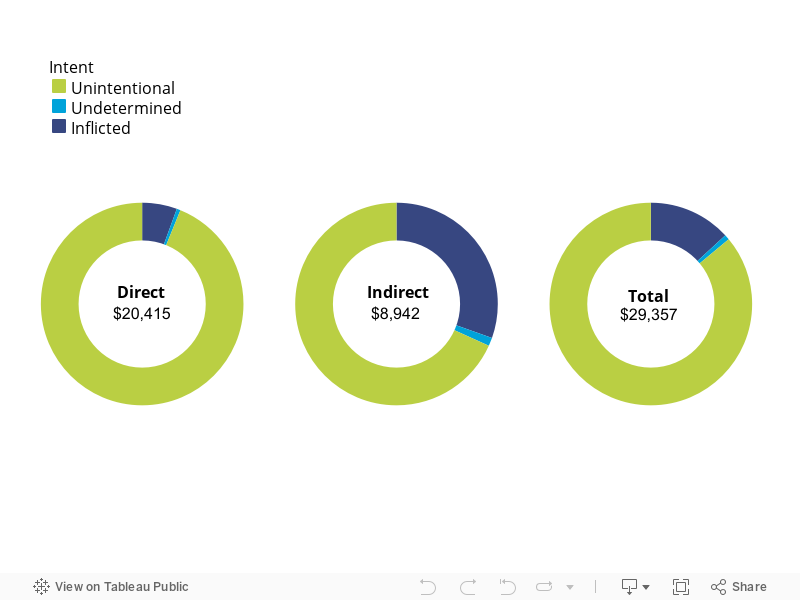
The direct cost of injury in 2018 was $20.4 billion or 70 per cent of the total economic cost of injury. The indirect cost was $8.9 billion, 30 per cent of the total cost.
Unintentional injuries accounted for 86 per cent of injury costs ($25.3 billion). Inflicted injuries accounted for a further 13 per cent ($3.9 billion) and injuries of undetermined intent for the remaining 1 per cent ($243 million).
Unintentional injuries still account for the vast majority of costs even when direct and indirect costs are examined separately. Direct costs for unintentional injuries amounted to $19.2 billion (94 per cent of all direct costs). Indirect costs
for unintentional injuries totalled $6.1 billion (68 per cent of all indirect costs).
Using Tableau
Many of the data figures include filters you can use to customize what is displayed. Use the filter drop-down menus at the top of the figure to select an age group, sex, cause, cost type or measure (e.g., cases or rates). When a filter is selected, the title and contents of the data figure will change automatically.
The Tableau tool bar at the bottom of each chart provides additional functionality:
Use the Share icon to copy a link to the figure, or to share it via email, Twitter, or Facebook.
Use the Download icon to download the figure as an image or PDF, or to download the data used
Use the Full-screen icon to enlarge the figure to fit the screen