Data-driven decision-making starts here. Access the most currently available statistics and visually engaging infographics that shed light on the prevalence, causes and impact of childhood falls.
Resources
-
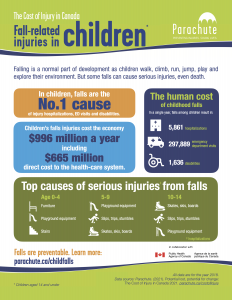
The impact of falls on children in Canada (infographic)
This infographic highlights Canadian statistics on falls in children aged 0 to 9 years. Data for this infographic were supplied by the Public Health Agency of Canada.
-
Atlantic Canada Child & Youth Unintentional Injury Hospitalizations: 10 years in review
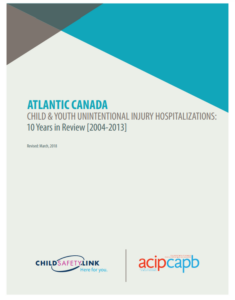
This report builds on the previous report from 2005 entitled Child & Youth Unintentional Injury Atlantic Canada: 10 years in review. Data was commissioned from the Canadian Institute for Health Information hospitalization trends (2004-2013) for childhood injury over a 10-year period, the most recent years for which data were available both at the national and provincial levels. The purpose of this report is to determine the pattern of injuries to children and youth in Atlantic Canada and, where possible, whether these injury patterns follow national trends. The data in this report mainly focus on hospitalizations of children from birth to age 14 (inclusive) and is about unintentional injuries only, including falls.
669.14 KB PDF
-
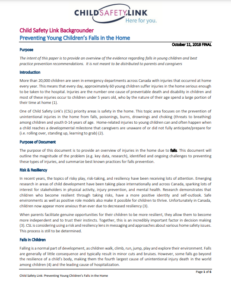
Child Safety Link – Backgrounder
-
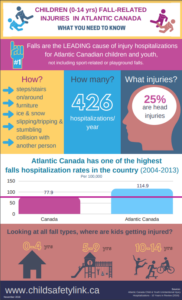
Child Safety Link – Infographic
-
Cost of injury – Falls in children infographic
-
Fact bank
-
Ontario Childhood Falls Infographic 2017
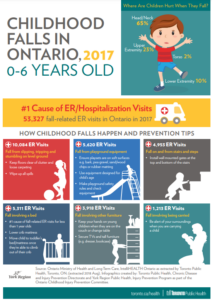
This infographic highlights statistics from Ontario data on falls in children ages 0 to 6 years. How childhood falls happen and where they are hurt are included. Data for this infographic were supplied by Toronto Public Health. This infographic was created in collaboration with York Region Public Health and Toronto Public Health.
73.94 KB PDF
